TL;DR:
- AI integration in real-time dashboards enables continuous data processing, anomaly detection, and insight generation without manual input. It accelerates insights by up to 70%, combating data decay and supporting rapid decision-making for operational environments. Trust is maintained through transparent dashboards grounded in high-quality data, guiding effective and governed AI deployment.
Real-time dashboards integrated with AI are defined as analytics environments where machine intelligence continuously processes live data streams, automates discovery, and surfaces decisions without waiting for human intervention. This combination is no longer optional for enterprise teams. Platforms like Power BI, Tableau, and Hymalaia have demonstrated that AI integration in analytics transforms raw operational feeds into decisions measured in minutes, not days. The core argument is direct: without AI, real-time dashboards show you what is happening. With AI, they tell you why it happened and what to do next.
Speed is the primary reason why real-time dashboards need AI integration, and the numbers are unambiguous. AI-driven automation reduces time-to-insight by up to 70% for data professionals and business leaders. That is not a marginal efficiency gain. It means an analysis that previously consumed a full business day now completes before your morning standup ends.

The urgency compounds when you factor in data decay. High-frequency operational data loses approximately 90% of its value if not analyzed immediately. A fraud signal that goes undetected for 20 minutes is no longer a signal. It is a loss. AI prevents that decay by running continuous pattern recognition across every incoming data point, flagging anomalies the moment they appear rather than waiting for a human analyst to notice a spike on a chart.
The mechanism behind this speed gain is agentic AI architecture. Rather than a single model scanning a dashboard, specialized AI agents orchestrate root-cause analysis and visualization in parallel, shrinking analysis cycles from days to minutes. Hymalaia’s platform applies this exact model, deploying autonomous agents that coordinate across data sources like Salesforce, Slack, and SharePoint to deliver context-rich answers without manual query writing.
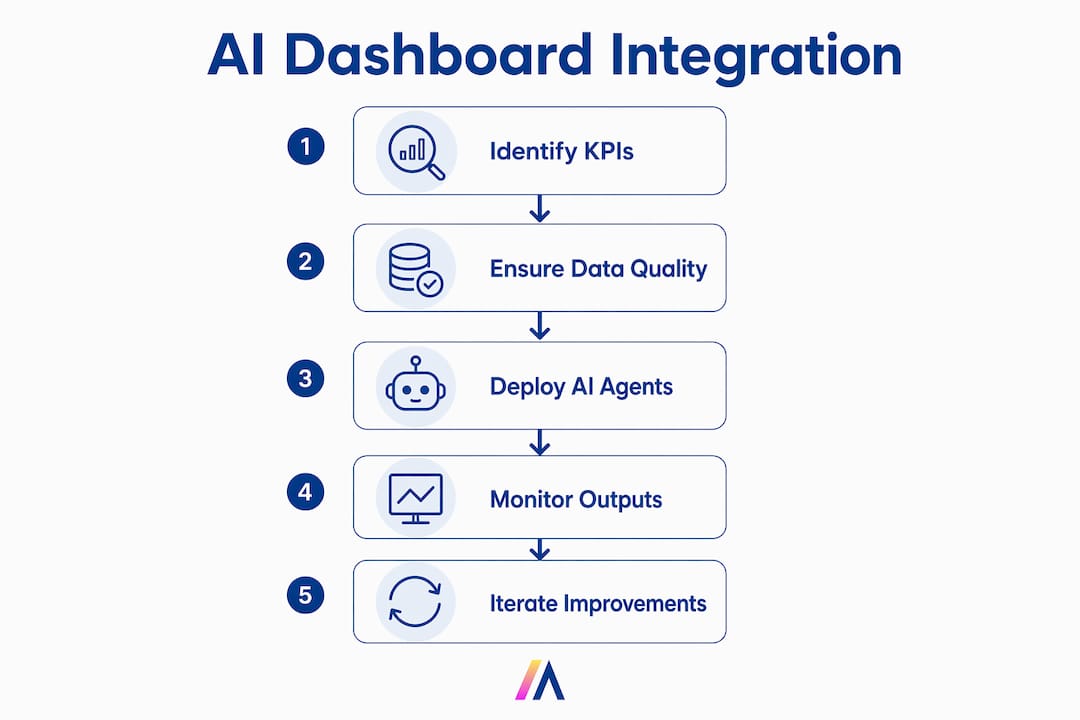
Pro Tip: Before deploying AI agents on your dashboard, map which KPIs carry the highest decision velocity. Those are your first automation targets. Applying AI uniformly across every metric creates noise, not speed.
AI integration in analytics raises a legitimate concern: if the model interprets live data incorrectly, the decision it drives could be worse than no decision at all. This is where the dashboard’s role becomes more critical, not less. Dashboards provide transparency and shared views that help teams trust and understand AI outputs, preventing hallucination risks from propagating into operations.
Think of the dashboard as the audit layer. When an AI agent flags a 40% drop in checkout conversion, the dashboard lets every stakeholder see the same underlying data simultaneously. That shared view prevents the AI’s conclusion from being accepted on faith alone. It grounds the insight in verifiable numbers, which is exactly what enterprise governance requires.
Andy Cotgreave, a recognized voice in data communication, frames this relationship clearly:
“Dashboards are not dying. They are becoming the communication infrastructure that makes AI outputs legible and trustworthy for human decision-makers.”
This trust architecture depends entirely on data quality upstream. AI magnifies the impact of bad data definitions, forcing organizations to harden governance and semantic data models before deployment. A semantic layer that defines “revenue” consistently across finance, sales, and operations is not a technical nicety. It is the prerequisite that prevents AI from generating confident but contradictory answers from the same dataset. Hymalaia’s enterprise AI adoption checklist addresses this directly, guiding IT leaders through governance hardening before any AI agent goes live on production data.
The practical implication: invest in your semantic model before you invest in your AI layer. Organizations that skip this step find that AI integration amplifies inconsistency rather than resolving it.
Not every metric justifies the infrastructure cost of real-time AI processing. Operations monitoring, fraud detection, and live sales are the prime use cases where delayed information carries direct financial cost. Batch processing remains the right choice for historical trend analysis, monthly reporting, and any metric where a 24-hour lag carries no operational consequence.
The decision framework is straightforward:
| Use case | Processing model | AI role |
|---|---|---|
| Fraud detection | Real-time streaming | Pattern recognition and instant alerting |
| Customer support SLA monitoring | Real-time streaming | Anomaly detection and escalation triggers |
| Monthly revenue reporting | Batch | Trend analysis and variance explanation |
| Inventory forecasting | Hybrid | Real-time depletion tracking plus batch demand modeling |
| Live sales pipeline | Real-time streaming | Predictive scoring and next-best-action recommendations |
The technical infrastructure for real-time AI dashboards typically involves Apache Kafka for high-throughput event streaming, Redis Streams for low-latency data queuing, and WebSocket connections to push live updates to the dashboard front end. These are not trivial components to operate. The real-time data analysis benefits only materialize when the underlying pipeline is stable and the AI layer has clean, consistent data to process.
Designing an AI-enhanced dashboard that drives action requires more discipline than designing a static report. The biggest failure mode is alert fatigue. When every metric triggers a notification, users stop reading notifications. Reducing update frequency from sub-second to every five minutes improved customer support resolution times by 15% in documented implementations. Slower, more deliberate updates force the AI to surface only what genuinely changed, not every micro-fluctuation in a noisy feed.
AI makes dashboards more interactive by enabling natural language queries, automated anomaly highlighting, and proactive insight generation. This shifts the user’s role from chart reader to decision executor. Instead of scanning 12 panels for the one that matters, the user asks “Why did support tickets spike at 2 PM?” and receives a ranked explanation with drill-down links to the underlying records.
Concrete design principles that separate effective AI dashboards from expensive noise generators:
Pro Tip: Test your dashboard with a 60-second rule. If a new user cannot identify the single most important insight within 60 seconds of opening the view, the AI layer is adding complexity rather than clarity. Redesign the information hierarchy before adding more automation.
The AI-powered operational analytics approach Hymalaia applies to enterprise clients follows this exact principle: agents surface the insight, the dashboard provides the context, and the user executes the decision. Each layer does what it does best.
AI integration transforms real-time dashboards from passive display tools into active decision systems, but only when built on governed data, purposeful architecture, and user-centered design.
| Point | Details |
|---|---|
| Speed gain is quantifiable | AI reduces time-to-insight by up to 70%, turning multi-day analysis into minutes. |
| Data decay demands immediacy | High-frequency operational data loses 90% of its value without real-time AI processing. |
| Dashboards anchor AI trust | Shared, transparent dashboard views prevent AI hallucinations from driving unchecked decisions. |
| Governance precedes AI deployment | Semantic layers and clean data definitions must exist before AI agents go live on production data. |
| Design for action, not volume | Refresh intervals of 5 to 10 minutes with clear change signals outperform sub-second updates in driving resolution. |
I have watched enterprise teams spend months selecting an AI vendor and configuring agent pipelines, only to discover that their dashboard data is inconsistent across business units. The AI then produces confident, fast, and wrong answers. The failure is not the AI. The failure is sequence.
The organizations that get real value from AI-enhanced real-time dashboards treat the dashboard as infrastructure first. They define what “conversion” means, what “active user” means, and what “at-risk account” means before they ask an AI to detect anomalies in those metrics. That definitional work is unglamorous. It does not appear in vendor demos. But it is the difference between an AI that accelerates decisions and one that accelerates confusion.
My second observation is about interactivity. The most underused capability in AI-enhanced dashboards is natural language querying. Most teams configure AI to push alerts. Far fewer configure it to answer questions. When a CFO can type “What drove the margin compression in Q2?” directly into a dashboard and receive a ranked, evidence-backed answer in 15 seconds, the entire relationship between executive and data changes. That is where the real productivity gain lives, not in faster chart refreshes.
The future of real-time dashboards is not more data on screen. It is less data, better explained, with AI doing the interpretive work so humans can focus on the decision itself.
— Matthieu
Hymalaia’s enterprise AI agent platform deploys autonomous agents that connect to over 50 data sources, including Salesforce, Slack, Google Workspace, and SharePoint, to analyze live data and surface decisions without manual querying. The platform’s retrieval-augmented generation (RAG) architecture grounds every AI response in your actual data, eliminating hallucination risk and making AI outputs auditable. For teams ready to move from reactive monitoring to proactive intelligence, Hymalaia provides the agent orchestration, governance controls, and platform features that make real-time AI dashboards both trustworthy and fast. Book a demo to see it in action.
AI integration in real-time dashboards means deploying machine learning models and autonomous agents that continuously process live data streams, detect anomalies, and generate insights without manual analysis. The result is a dashboard that explains what is happening and recommends what to do next.
AI-driven automation reduces time-to-insight by up to 70%, compressing analysis cycles that previously took days into minutes. This speed gain is most pronounced in high-frequency operational environments like fraud detection and live sales monitoring.
AI dashboards do not replace analysts. They automate pattern detection and root-cause tracing so analysts focus on interpretation and decision-making rather than data retrieval. The dashboard remains the trusted audit layer that validates AI-generated conclusions.
Real-time AI dashboards typically rely on Apache Kafka for event streaming, Redis Streams for low-latency queuing, and WebSocket connections for live front-end updates. A clean semantic layer defining consistent business metrics is the non-negotiable prerequisite before any AI layer goes live.
Set refresh intervals based on metric criticality rather than technical capability. Updating dashboards every 5 to 10 minutes with clear change indicators, rather than streaming every micro-fluctuation, reduces cognitive overload and improves user response rates.
